Nombre total de pages vues

jeudi 15 décembre 2011

WeatherSpect

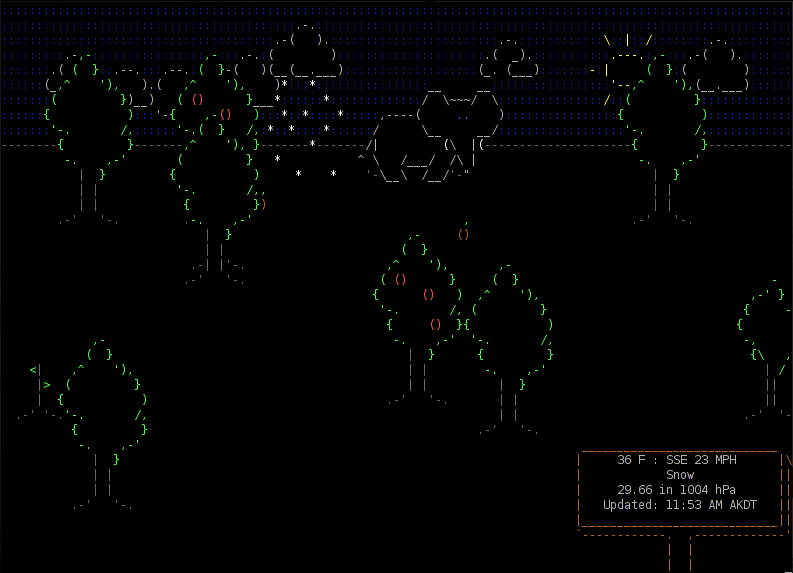
Another cool tools for geeks: WeatherSpect. Distributed on Robobunny website (same as ASCIIQuarium).

This program uses weather data supplied by the Weather::Underground module to create an ASCII animation that simulates the weather. There is also a large number of random creatures and objects that walk across this screen.
Install the prerequisites if you haven't already done (for CentOS distro as usual):
cpan install Term::Animation
yum install -y perl-Curses
Install WeatherSpect:
cd /downloads/
wget http://robobunny.com/projects/weatherspect/weatherspect.tar.gz
tar -xvzf weatherspect.tar.gz
cd weatherspect_v1.9/
chmod 755 weatherspect
cp weatherspect /usr/bin/
cd ~
Generate config file:
[root@ygwane ~]$ weatherspect -c
Accepted formats for location:
        Zipcode
        City
        City, State
        State
        City, Country
        Country
Your Location: Apt, France
Temperature ( (C)elsius, (F)ahrenheit, (B)oth ) [B] C
Wind Speed ( (K)PH, (M)PH, (B)oth ) [B] K
Creating config file in /root/.weatherspect...
It's possible to change your location (and some others features) by editing the config file /root/.weatherspect ...

Now have fun ! (press 'q' for quit)
weatherspect
We can have a weather report by pressing 'w' (press again 'w' to close the report)

Screenshot:
Website: http://robobunny.com/projects/weatherspect/html/

vendredi 9 décembre 2011

ASCIIQuarium

For all geeks who are searching funny and useless tools, I wanna show you the better one for me: ASCIIQuarium ...
This is an ascii aquarium screensaver for Linux terminals that permits to: "Enjoy the mysteries of the sea from the safety of your own terminal!"

First we have to install the prerequisites (for CentOS distro as usual):
cpan install Term::Animation
yum install -y perl-Curses
Then, we can install ASCIIQuarium:
cd /downloads
wget http://www.robobunny.com/projects/asciiquarium/asciiquarium.tar.gz
tar -xvzf asciiquarium.tar.gz
cd asciiquarium_1.0/
chmod 755 asciiquarium
cp asciiquarium /usr/bin/
cd ~
Woaw ! The sysadmins will be able to relax with this beautiful fish tank henceforth ...
asciiquarium
Screenshot:
Website: http://robobunny.com/projects/asciiquarium/html/

Speedometer

Here is an interesting project that permits to display and measure the rate of data across a network connection or data being stored in a file. This tool is named Speedometer. He needs python 2.6 (or higher) to operate.
We're gonna see how to install it and use it. It's really easy !

For Debian based distros, simply launch:
apt-get install speedometer
For others distros (like us with CentOS), We first have to download and install Urwid:
cd /downloads
wget http://excess.org/urwid/urwid-1.0.1.tar.gz
tar -xvzf urwid-1.0.1.tar.gz
cd urwid-1.0.1
python setup.py install
Then we can install Speedometer like this:
cd /downloads
wget http://excess.org/speedometer/speedometer-2.8.tar.gz
tar -xvzf speedometer-2.8.tar.gz
cp speedometer.py /usr/local/bin/speedometer
chown root: /usr/local/bin/speedometer
chmod 755 /usr/local/bin/speedometer
That's all ! Now, let's see the help command of this little tool:
[root@localhost ~]$ speedometer
Usage: speedometer [options] tap [[-c] tap]...
Monitor network traffic or speed/progress of a file transfer.  At least one
tap must be entered.  -c starts a new column, otherwise taps are piled
vertically.

Taps:
  -f filename [size]          display download speed [with progress bar]
  -r network-interface        display bytes received on network-interface
  -t network-interface        display bytes transmitted on network-interface
  -c                          start a new column for following tap arguments

Options:
  -b                          use old blocky display instead of smoothed
                              display even when UTF-8 encoding is detected
                              (use this if you see strange characters)
  -i interval-in-seconds      eg. "5" or "0.25"   default: "1"
  -k (1|16|88|256)            set the number of colors this terminal
                              supports (default 16)
  -l                          use linear charts instead of logarithmic
                              you will VERY LIKELY want to set -m as well
  -m chart-maximum            set the maximum bytes/second displayed on
                              the chart (default 2^32)
  -n chart-minimum            set the minimum bytes/second displayed on
                              the chart (default 32)
  -p                          use original plain-text display (one tap only)
  -s                          use bits/s instead of bytes/s
  -x                          exit when files reach their expected size
  -z                          report zero size on files that don't exist
                              instead of waiting for them to be created

Note: -rx and -tx are accepted as aliases for -r and -t for compatibility
with earlier releases of speedometer.  -f may be also omitted for similar
reasons.

Python Version: 2.7
Urwid >= 0.9.9.1 detected: yes  UTF-8 encoding detected: yes
To display live RX traffic on eth0 network interface, simply launch (press 'q' to quit):
speedometer -rx eth0
To display live TX traffic on eth0 network interface, launch:
speedometer -tx eth0

Here's some usage examples given on Speedometer Web page:

How long it will take for my 38MB transfer to finish?
speedometer favorite_episode.rm $((38*1024*1024))
How quickly is another transfer going?
speedometer dl/big.avi
How fast is this LAN?
host-a$ cat /dev/zero | nc -l -p 12345

host-b$ nc host-a 12345 > /dev/null 
host-b$ speedometer -rx eth0
How fast is the upstream on this ADSL line? (start an upload first)
speedometer -tx ppp0
How fast can I write data to my filesystem? (with at least 1GB free)
dd bs=1000000 count=1000 if=/dev/zero of=big_nothing &
speedometer big_nothing
To finish, let me show you some screenshots that we can see on Speedometer Web page:

Link to Speedometer Web page: http://excess.org/speedometer/

mardi 15 novembre 2011

Move MySQL datadir

We are going to see how to move MySQL datadir without loosing data. This is usefull when you meet a disk space problem or when you want to change your database server.

Operation is very simple, we just have to create a new directory in which we are going to copy the old datadir content. MySQL must be stopped before the copy to be sure that nothing will be modified during the data copy. Then we have to edit the mysql config file to define the new datadir. Finally, restart MySQL server and check that everything is ok. old mysql datadir: /var/lib/mysql new mysql datadir: /opt/mysql/datadir Here is the detail of commands:
# create directory, chown, chmod it
mkdir /opt/mysql/datadir
chown mysql:mysql /opt/mysql/datadir
chmod 0755 /opt/mysql/datadir

# save my.cnf
cp /etc/my.cnf /etc/my.cnf.bak

# stop mysql
/etc/init.d/mysql.server stop

# change datadir in my.cnf
vim /etc/my.cnf

:%s?/var/lib/mysql?/opt/mysql/datadir?g

:wq

# copy old datadir to new datadir
cp -rp /var/lib/mysql/* /opt/mysql/datadir/

# start mysql
/etc/init.d/mysql.server start
Now it's important to check that everything working fine, if all is ok we can remove the old datadir:
rm -rf /var/lib/mysql
Otherwise, we go back like this:
/etc/init.d/mysql.server stop
mv /etc/my.cnf /etc/my.cnf2 && mv /etc/my.cnf.bak /etc/my.cnf
/etc/init.d/mysql.server start

mercredi 2 novembre 2011

PHP Server Monitor

PHP Server Monitor is a script that monitors the status of a server or service in a list on a given port. It comes with a web interface from which you can add a server or service, this interface is coupled to a MySQL database. We can also manage users will be alerted for each service by mail or SMS in case of failure. To check a site, the script will use cURL to interpret the HTTP code.

Features:
* check if services (ie IMAP) are up and running on your servers
* check if websites are available (ie no 404 Not found errors)
* get email notifications if a server or website goes down
* get sms (text message) notifications if a server or website goes down
* add multiple users with email address and phone number
* choose who receives the notifications for each server
* easy to use interface
* saves all errors in a log table
* see response time from servers and websites
* separate cronjob file

Install:
cd /downloads
wget http://downloads.sourceforge.net/.../phpservermon-2.0.1.zip...
unzip phpservermon-2.0.1.zip
mv phpservermon /var/www/html/
chown -R apache:apache /var/www/html/phpservermon
cd /var/www/html/phpservermon
mv config.inc.php.sample config.inc.php
vim config.inc.php

// Database information
// Prefix used for tables
define('SM_DB_PREFIX', 'monitor_');
// Database username
define('SM_DB_USER', 'root');
// Database password
define('SM_DB_PASS', 'yourpassword');
// Database name
define('SM_DB_NAME', 'phpservermon');
// Database host
define('SM_DB_HOST', 'localhost');

:wq

mysql -e "create database phpservermon;" 

http://myserver/phpservermon/install.php

rm /var/www/html/phpservermon/install.php

Use:
http://myserver/phpservermon

To check services, we need to configure a cron job with provided script in project:
crontab -e

*/5 * * * * /usr/bin/php -q /var/www/html/phpservermon/cron/status.cron.php

:wq


Project page:
http://sourceforge.net/projects/phpservermon/

jeudi 6 octobre 2011

Bash: script compte à rebours

Voici un petit script bash permettant d'afficher un compte à rebours dans le shell. On va utiliser une fonction pour ça: decompte. On va afficher un décompte de 30 secondes avant de revenir sur le prompt.
[root@localhost ~]# vim compte_a_rebours.sh

#!/bin/bash

# fonction rebours
# Affichage d'un compte à rebours
# Usage : rebours [nombre de secondes]
# Notes : le "echo -e" permet l'utilisation des caractères spéciaux
decompte() {
    i=$1
    echo " "
    while [[ $i -ge 0 ]]
      do
        echo -e "\033[31m\r "$i" \c\033[0m"
        sleep 1
        i=$(expr $i - 1)
    done
    echo " -  "
    echo -e "\033[32mFin du decompte\033[0m"
}


# appel d'un compte à rebours de 5 secondes
decompte 30
exit

:wq

[root@localhost ~]# chmod 755 compte_a_rebours.sh
[root@localhost ~]# ./compte_a_rebours.sh

 0  -
Fin du decompte
[root@localhost ~]# 

lundi 3 octobre 2011

Apache benchmark with Siege


Siege is an http load testing and benchmarking utility. It was designed to let web developers measure their code under duress, to see how it will stand up to load on the internet. Siege supports basic authentication, cookies, HTTP and HTTPS protocols. It lets its user hit a web server with a configurable number of simulated web browsers. Those browsers place the server "under siege."

Siege can be installed with yum (2.66 version from rpmforge repo or 2.70 version from epel repo) or from sources that can be found on the project website. In our case, we will use rpm package from epel repo.

Installation and initial configuration :
[root@localhost ~]# yum install siege -y
[root@localhost ~]# siege.config
New configuration template added to /root/.siegerc
Run siege -C to view the current settings in that file
[root@localhost ~]# siege -C
CURRENT  SIEGE  CONFIGURATION
JoeDog/1.00 [en] (X11; I; Siege 2.70)
Edit the resource file to change the settings.
----------------------------------------------
version:                        2.70
verbose:                        true
debug:                          false
protocol:                       HTTP/1.1
connection:                     close
concurrent users:               15
time to run:                    n/a
repetitions:                    n/a
socket timeout:                 30
delay:                          1 sec
internet simulation:            false
benchmark mode:                 false
failures until abort:           1024
named URL:                      none
URLs file:                      /usr/etc/urls.txt
logging:                        true
log file:                       /var/siege.log
resource file:                  /root/.siegerc
allow redirects:                true
allow zero byte data:           true
allow chunked encoding:         true
proxy auth:
www auth:
Available options:
[root@localhost ~]# siege -h
SIEGE 2.70
Usage: siege [options]
       siege [options] URL
       siege -g URL
Options:
  -V, --version           VERSION, prints the version number.
  -h, --help              HELP, prints this section.
  -C, --config            CONFIGURATION, show the current config.
  -v, --verbose           VERBOSE, prints notification to screen.
  -g, --get               GET, pull down HTTP headers and display the
                          transaction. Great for application debugging.
  -c, --concurrent=NUM    CONCURRENT users, default is 10
  -i, --internet          INTERNET user simulation, hits URLs randomly.
  -b, --benchmark         BENCHMARK: no delays between requests.
  -t, --time=NUMm         TIMED testing where "m" is modifier S, M, or H
                          ex: --time=1H, one hour test.
  -r, --reps=NUM          REPS, number of times to run the test.
  -f, --file=FILE         FILE, select a specific URLS FILE.
  -R, --rc=FILE           RC, specify an siegerc file
  -l, --log[=FILE]        LOG to FILE. If FILE is not specified, the
                          default is used: PREFIX/var/siege.log
  -m, --mark="text"       MARK, mark the log file with a string.
  -d, --delay=NUM         Time DELAY, random delay before each requst
                          between 1 and NUM. (NOT COUNTED IN STATS)
  -H, --header="text"     Add a header to request (can be many)
  -A, --user-agent="text" Sets User-Agent in request

Copyright (C) 2010 by Jeffrey Fulmer, et al.
This is free software; see the source for copying conditions.
There is NO warranty; not even for MERCHANTABILITY or FITNESS
FOR A PARTICULAR PURPOSE.
Testing:
[root@localhost ~]# siege -b -c 10 -r 3 http://nuxadmin.blogspot.com
** SIEGE 2.70
** Preparing 10 concurrent users for battle
The server is now under siege...
HTTP/1.1 200   1.04 secs:   95476 bytes ==> /
HTTP/1.1 200   1.17 secs:   95476 bytes ==> /
HTTP/1.1 200   1.19 secs:   95476 bytes ==> /
HTTP/1.1 200   1.56 secs:   95476 bytes ==> /
HTTP/1.1 200   1.80 secs:   95476 bytes ==> /
HTTP/1.1 200   0.79 secs:   95476 bytes ==> /
HTTP/1.1 200   1.85 secs:   95476 bytes ==> /
HTTP/1.1 200   2.07 secs:   95476 bytes ==> /
HTTP/1.1 200   1.12 secs:   95476 bytes ==> /
HTTP/1.1 200   0.81 secs:   95476 bytes ==> /
HTTP/1.1 200   2.78 secs:   95476 bytes ==> /
HTTP/1.1 200   1.07 secs:   95476 bytes ==> /
HTTP/1.1 200   0.85 secs:   95476 bytes ==> /
HTTP/1.1 200   2.93 secs:   95476 bytes ==> /
HTTP/1.1 200   1.15 secs:   95476 bytes ==> /
HTTP/1.1 200   0.91 secs:   95476 bytes ==> /
HTTP/1.1 200   2.16 secs:   95476 bytes ==> /
HTTP/1.1 200   1.68 secs:   95476 bytes ==> /
HTTP/1.1 200   1.31 secs:   95476 bytes ==> /
HTTP/1.1 200   0.78 secs:   95476 bytes ==> /
HTTP/1.1 200   1.20 secs:   95476 bytes ==> /
HTTP/1.1 200   1.37 secs:   95476 bytes ==> /
HTTP/1.1 200   2.00 secs:   95476 bytes ==> /
HTTP/1.1 200   1.45 secs:   95476 bytes ==> /
HTTP/1.1 200   1.36 secs:   95476 bytes ==> /
HTTP/1.1 200   0.61 secs:   95476 bytes ==> /
HTTP/1.1 200   0.58 secs:   95476 bytes ==> /
HTTP/1.1 200   5.55 secs:   95476 bytes ==> /
HTTP/1.1 200   0.49 secs:   95476 bytes ==> /
HTTP/1.1 200   0.47 secs:   95476 bytes ==> /
done.                                                                                                                                                             Transactions:                      30 hits
Availability:                 100.00 %
Elapsed time:                   6.52 secs<
Data transferred:               2.73 MB
Response time:                  1.47 secs
Transaction rate:               4.60 trans/sec
Throughput:                     0.42 MB/sec
Concurrency:                    6.76
Successful transactions:          30
Failed transactions:               0
Longest transaction:            5.55
Shortest transaction:           0.47

FILE: /var/siege.log
You can disable this annoying message by editing
the .siegerc file in your home directory; change
the directive 'show-logfile' to false
Another test:
[root@localhost ~]# siege -c 30 -i -t 30s -d 5 http://nuxadmin.blogspot.com
...
Lifting the server siege...      done.                                           Transactions:                     167 hits
Availability:                 100.00 %
Elapsed time:                  29.59 secs
Data transferred:              15.21 MB
Response time:                  2.48 secs
Transaction rate:               5.64 trans/sec
Throughput:                     0.51 MB/sec
Concurrency:                   13.99
Successful transactions:         167
Failed transactions:               0
Longest transaction:            6.84
Shortest transaction:           0.78
...